I have been avoiding it, but it is time to think about what these last weeks mean for Venezuela. Whether we like it, political tectonics are at work and January announces itself as a very difficult month, though January may start before December 31. To try to simplify this a little bit let's start with what apparently not even tectonic forces can change.
The premise of the political crisis is that a group of gangsters have taken over the country and there is no way they are going to forgo control because they know that any improvement in governance means that they will end up in jail. It is that simple, it explains it all. It even explains why the outside world is not doing much because they know that gangsters can only be disposed off through violence. After all, the democratic West did nothing for Aleppo, why should we assume they would do something for Caracas? I am looking at you Obama, by the way.
The other factor that is not changing and makes the above one the worse is the economic crisis. The nature of this one at this point is such that only a change of personnel at Miraflores Palace can offer a faint hope of improvement. What happened in December with state sponsored confiscations, reaction looting and currency debacle should carve that in.
Thus we can discuss the options for each side.
Chavismo has a Maduro problem. His erratic behavior and his absolute incompetence keeps making the crisis worse by the day. Until now he had the legitimacy that Chavez gave him which was replaced fast by the need for a figure head to preside over the country while corrupts, gangs, Cubans and the like fought it out over controlling Venezuela. This will not do anymore.
Maduro (or the people he spoke for) have made two grievous mistakes. The first one was to pass a budget without it being voted as a law by the National Assembly. That unconstitutional fiat was bad enough, as no one would lend money without a legal process of state guarantee. But it got worse for would be lenders, if any. The stupendous crass management of the banknote change early this month has killed any credit or authority he may have had inside chavismo. That is, deciding that the 100 banknote was illegal, then shortening the time for exchange and deposit the notes, and THEN offer a spectacular neck breaking U-turn once rioting started is the kind of political mistake that will kill the love of your most ardent supporters. While making sure that no one will lend you a penny. Not a slight petty problem for a bankrupt country.
Maduro is done, he cannot rule anymore. In any country with a semblant of normal he would have resigned by now, or asked to do so by his own party. Nobody will willingly obey him anymore. For Maduro and chavismo there are only two paths ahead, either go the massive repression way as of right now, or resign mid January to let a newly named vice president, likely a general, to deal with the last two years of the presidential term. I am going on record that by March first 2017 we will either have a new president or hundreds of new political prisoners with possibly hundreds of killed folks. Though the two are not exclusive, unfortunately....
On the opposition side the ability to resit and offer solutions seems gone to naught. The dialogue forced upon it by Obama though Thomas Shannon has proven its undoing. It should not have been so but it has. We have reached the point were the leadership of the opposition is admitting that they underestimated the resolve of the regime. Clearly, they would have benefited from reading this blog.
The reason for such paralysis is that some inside the opposition alliance will not agree on any hard measure of active resistance unless the result ensures them to be on top. If that is not possible then these people have no major problem in helping the regime survive until the time comes for them to be on top. How extensive is this inside the opposition leadership I do not know. But it is clear now that the local political Zulia group, UNT, whose national hopes have failed, will satisfy itself with its leader, Rosales, back in the streets and the new governor of Zulia from its ranks. UNT is the first clear suspect but I am afraid it is not the lone one.
The debacle of the new Electoral Board election was the main evidence for that more than duplicitous role of UNT. In the end it does not matter who is directing the Electoral Board CNE since there is no election in sight. But the point of UNT dealing behind the opposition back was painfully put forward. That was way worse than who ever is sitting at the CNE.
How can the opposition alliance MUD recover from these recent setbacks escapes me. They had a 2/3 majority seats and, well, they could do nothing about it. But that I can still understand, considering that they are dealing with gangsters. In fact I even made excuses for them through the year. What I cannot understand is that a year passed and there has been no red line left uncrossed, no Little Big Horn moment, nothing to show. And I suspect that even the little bit of international good will harvested in the first 6 months of 2016 has been wasted. With Trump election and a shifting of foreign paradigms I wonder if anyone will care much about Venezuela's fate anymore. As far as I can see it, Trump administration is not only willing to revive the Cuban embargo but will have no qualms including in it Venezuela letting Colombia and Brazil deal with the millions of refugees. Venezuela, the next refugee crisis? See if Trump cares a shit. A country full of Machados.....
So now what?
Such a sad Christmas
This is the saddest Christmas I have ever seen in Venezuela. Admittedly Christmas may be sad for some according to family or health issues, but the country as a while still somehow manages to get into the spirit. But this year people gave up. They just gave up.
How could it be otherwise? People do not even have enough cash, literally, for shopping the Christmas essentials. In Venezuela that would be to build up an Hallaca, the Christmas dish. And even if you had enough banknotes, or a well furbished checking account, there are so many staples that cannot be found or are so far out of reach that many this year will have no hallaca on their plates. And many will simply have little on their plate. Period.
Last week was a frantic obstacle course for yours truly, combining a chimio session for the S.O. to buy enough food basics to hold out until January 15 at the very least. Thus I saw Caracas first hand.
Christmas decorations, to begin with, are limited to perfunctory ones in banks and the like. Rare are the private homes or appartements with any light hanging in front. In fact, in my street only one house has the full gaudy display. NO OTHER neighbor put even a light on a window.
But if you think that my choice of starting with decorations is frivolous, let me tell you that it is on purpose, to delay my writing on the other nasty stuff. The lines have been humongous all week, For food, for a few banknotes at the banks, What was worse is that the regime after stealing all the toys from the main Caracas importer has decided to also steal the clothes from EPK, a business on children clothes, etc. I cannot tell you how pathetic, how a feel-terrible experience is to watch hundreds of people standing in long lines to benefit of that loot. What a miserable populace this country has become.
Traffic has been almost as horrendous as in normal days. Few left on holiday. Few can travel over seas. Few will bother to travel visit their relatives as the food and services situation outside of Caracas is much worse than in Caracas. It would be an unfair imposition on your relatives. You'll have to do without family reunion this year.
Sadder still is the amount of people scavenging, everywhere it seems. The worst for me was when I stopped at a given pharmacy in the never ending search for this or that. When I came back to my car I was startled to see somehow sitting down at the opposite corner of my car. Having been robbed three times this year I was duly concerned. And then I realized that the chap, a late teenager, skinny but with a baseball cap and bermudas, was eating something he had found in the trash bags next on the sidewalk. I do not know how I did not puke. Maybe I was so angry, with such a need to cry that it cancelled....
This is really getting awful, and the "needs" of the season make you more aware of your everyday misery and the hopelessness that settles everywhere. Even the regime in spite of a continued stream of cheap propaganda with people dancing folk dances, I suppose to let us get used tot he idea that soon we will lose communication with the outside world, cannot convince "el pueblo" who looks the saddest. How is it possible that you spend December 23 in line to get, say, a liter of oil? That there will be nothing for the kids? Not even food in some cases? What TV propaganda show can make up for that? How cynical the regime can get?
But Christmas is also a thanksgiving time for those of us who live outside the US. I am thankful that I get to spend one more with my SO and that I ruined myself but was able to get him the curent chimio treatment. He will not join, yet, the list of those who have stopped treatment in a country where you cannot even find morphine to assuage your last days.
I am thankful that my elderly parents are safe and confortable in France and got used to the idea that they will never be able to return to Venezuela. In fact, in their little Podunk they did manage to find all what it took to build the Venezuelan Christmas plate that so few of us will be able to have this Christmas. ALL INGREDIENTS in a country that prefers foie gras to exotic food for Christmas, amen of hallacas.
I am thankful that I still have family here though one niece left this year and a cousin family will leave early next year. In a little bit over an hour we will still manage to be 9, trying to forget a little bit drinking one of our three last bottles of French champagne.
Through the years we all will be together
If the fates allow
And my dog is grateful that the country is so bankrupt that there is no fireworks this year. All pets are thankful, for once.
The fates have reached us.
Still, for thus that are away, for the families, the hundred of thousands of broken Venezuelan families, for the faithful readers of this blog, may you have a good Christmas, make me live vicariously.
Alpha es et O
How could it be otherwise? People do not even have enough cash, literally, for shopping the Christmas essentials. In Venezuela that would be to build up an Hallaca, the Christmas dish. And even if you had enough banknotes, or a well furbished checking account, there are so many staples that cannot be found or are so far out of reach that many this year will have no hallaca on their plates. And many will simply have little on their plate. Period.
Last week was a frantic obstacle course for yours truly, combining a chimio session for the S.O. to buy enough food basics to hold out until January 15 at the very least. Thus I saw Caracas first hand.
Christmas decorations, to begin with, are limited to perfunctory ones in banks and the like. Rare are the private homes or appartements with any light hanging in front. In fact, in my street only one house has the full gaudy display. NO OTHER neighbor put even a light on a window.
But if you think that my choice of starting with decorations is frivolous, let me tell you that it is on purpose, to delay my writing on the other nasty stuff. The lines have been humongous all week, For food, for a few banknotes at the banks, What was worse is that the regime after stealing all the toys from the main Caracas importer has decided to also steal the clothes from EPK, a business on children clothes, etc. I cannot tell you how pathetic, how a feel-terrible experience is to watch hundreds of people standing in long lines to benefit of that loot. What a miserable populace this country has become.
Traffic has been almost as horrendous as in normal days. Few left on holiday. Few can travel over seas. Few will bother to travel visit their relatives as the food and services situation outside of Caracas is much worse than in Caracas. It would be an unfair imposition on your relatives. You'll have to do without family reunion this year.
Sadder still is the amount of people scavenging, everywhere it seems. The worst for me was when I stopped at a given pharmacy in the never ending search for this or that. When I came back to my car I was startled to see somehow sitting down at the opposite corner of my car. Having been robbed three times this year I was duly concerned. And then I realized that the chap, a late teenager, skinny but with a baseball cap and bermudas, was eating something he had found in the trash bags next on the sidewalk. I do not know how I did not puke. Maybe I was so angry, with such a need to cry that it cancelled....
This is really getting awful, and the "needs" of the season make you more aware of your everyday misery and the hopelessness that settles everywhere. Even the regime in spite of a continued stream of cheap propaganda with people dancing folk dances, I suppose to let us get used tot he idea that soon we will lose communication with the outside world, cannot convince "el pueblo" who looks the saddest. How is it possible that you spend December 23 in line to get, say, a liter of oil? That there will be nothing for the kids? Not even food in some cases? What TV propaganda show can make up for that? How cynical the regime can get?
But Christmas is also a thanksgiving time for those of us who live outside the US. I am thankful that I get to spend one more with my SO and that I ruined myself but was able to get him the curent chimio treatment. He will not join, yet, the list of those who have stopped treatment in a country where you cannot even find morphine to assuage your last days.
 |
| Not in Venezuela |
I am thankful that my elderly parents are safe and confortable in France and got used to the idea that they will never be able to return to Venezuela. In fact, in their little Podunk they did manage to find all what it took to build the Venezuelan Christmas plate that so few of us will be able to have this Christmas. ALL INGREDIENTS in a country that prefers foie gras to exotic food for Christmas, amen of hallacas.
I am thankful that I still have family here though one niece left this year and a cousin family will leave early next year. In a little bit over an hour we will still manage to be 9, trying to forget a little bit drinking one of our three last bottles of French champagne.
Through the years we all will be together
If the fates allow
And my dog is grateful that the country is so bankrupt that there is no fireworks this year. All pets are thankful, for once.
The fates have reached us.
Still, for thus that are away, for the families, the hundred of thousands of broken Venezuelan families, for the faithful readers of this blog, may you have a good Christmas, make me live vicariously.
Alpha es et O
Accelerating Warming of the Arctic Ocean
Stronger Winds causing further Warming of the Arctic Ocean
Warming is accelerating in the Arctic. On December 22, 2016, the Arctic was on average 3.33°C or 5.99°F warmer than it was in 1979-2000.

Within the Arctic, the Arctic Ocean is warming most rapidly. The image below gives a snapshot of the situation on December 22, 2016 at 06:00 UTC. The Arctic as a whole was as much as 3.34°C or 6.01°F warmer than in 1979-2000. At the same time, temperatures over much of the Arctic Ocean were at the top end of the scale, i.e. as much as 30°C or 54°F warmer than in 1979-2000 (pink color at 90°N latitude).

The temperature in the Arctic (north of 80°N Latitude) is also illustrated by the image below. The red line of the temperature for 2016, up to December 22, 2016. The green line is the 1958-2002 temperature.

Over the entire year 2016, warming was most profound over the Arctic Ocean, which was more than 2.5°C or 4.5°F warmer than 1981-2010, as illustrated by the image below.

The animation below illustrates how this anomaly developed over the past few years, each time showing a 365-day period, starting in 2014 and each time shifted by roughly one month.

These high temperatures over the Arctic Ocean reflect warm water of the Arctic Ocean, with heat added from the Atlantic Ocean and the Pacific Ocean. The image below shows ocean warming, with temperatures rising particularly rapidly on the Northern Hemisphere.
 |
| [ Ocean warming, from earlier post ] |

Above image shows winds on December 29, 2016.
 |
| [ click on images to enlarge ] |

Sea surface temperatures west of Svalbard were as high as 14.6°C (58.2°F) on December 29, 2016. Sea surface temperature went up at the end of December at this spot, while the longer-term average went down in line with the change in seasons.


The fact that the North Pacific shows a huge cold area, while the cold area in the North Atlantic has virtually disappeared, suggests that the cold area in the North Pacific is not the result of melt-water. The path of the cold areas and the low temperatures over the continents at higher latitudes, give further indications that strong winds are causing such cold areas. The image below shows that a cold area reappearing in the North Atlantic as it gets hit by strong winds (see video further below).

Above images and the image below, from an earlier post, illustrate how stronger evaporation and the resulting precipitation, at times in combination with melt-water, could create cold freshwater lids on both the North Atlantic and the North Pacific. The situation in the North Atlantic is very dangerous, as such a lid can cause much more heat to get carried into the Arctic Ocean underneath the sea surface of the North Atlantic, due to reduced heat transfer to the atmosphere from water on its way to the Arctic Ocean.

The image below, from an earlier post, shows the depth of Barents Sea, which is relatively shallow around Svalbard.

 As the image on the right shows, this spot warms up due to a sea current that brings warm water from the North Atlantic into the Arctic Ocean.
Above images give an indication of the temperature of the water in the Atlantic Ocean underneath the sea surface, as the water comes to the surface near Svalbard, as also illustrated by the plot on the right.
The Arctic Ocean is now warming underneath the sea ice due to the inflow of warm water from the Atlantic Ocean and the Pacific Ocean.
The Arctic Ocean is also warming due to feedbacks such as increased levels of water vapor in the atmosphere, warmer river water running into the Arctic Ocean and soot from wildfires that can settle on snow and ice, resulting in further albedo changes.
Further feedbacks of global warming include warmer air temperatures, higher waves and stronger winds that all speed up the demise of snow and ice.
Stronger winds are pushing warm water from the North Atlantic into the Arctic Ocean. Why are these winds getting stronger? As the Arctic warms faster than the rest of the world, the temperature difference between the Arctic and the Equator decreases, making the Jet Stream wavier, with longer loops extending to the north and to the south. At the same time, the temperature difference between the oceans and the continents (Europe, Asia and North America) is increasing, speeding up the Jet Stream as it travels, e.g., over the North Atlantic towards the Arctic Ocean.
 |
| [ click on images to enlarge ] |
The situation is further illustrated by the video below, showing winds over the North Atlantic from December 27, 2016 to January 3, 2017, as forecasts by cci-reanalyzer.org.
 The fact that this is not a one-off event is also illustrated by the image on the right, showing that the Jet Stream reached speeds of 384 km/h or 239 mph over the Pacific Ocean on December 27, 2015. At the same day and time in 2015, the Jet Stream reached speeds as high as 430 km/h or 267 mph as it moved over North America on its way over the North Atlantic.
In conclusion, increasingly stronger winds are causing huge amounts of heat to enter the Arctic Ocean from the North Atlantic, and also from the Pacific Ocean. As the water of the Arctic Ocean keeps warming, the danger increases that methane hydrates at the bottom of the Arctic Ocean will destabilize.


Continued warming could trigger huge abrupt methane eruptions leading to mass destruction and extinction.
 |
| Potential warming by more than 10°C or 18°F by 2026 (from: Climate Plan Summary, see also: the extinction page) |
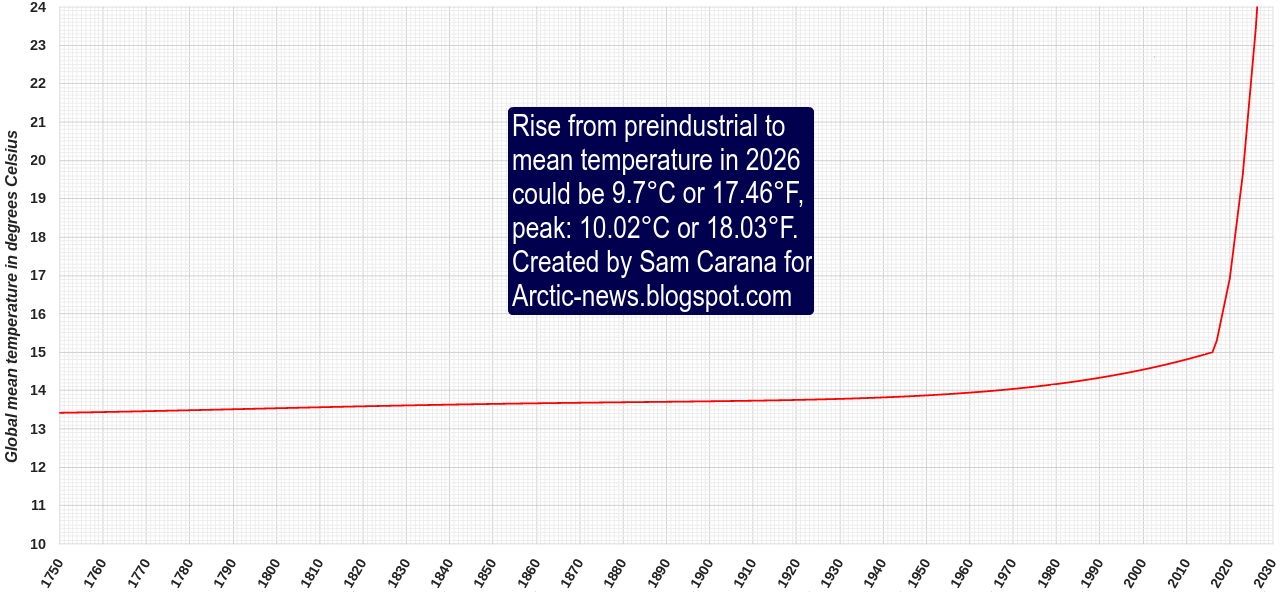
The image below shows the associated temperature rise from preindustrial to 2026, with figures discussed in more detail on the Temperature page.
The situation is dire and calls for comprehensive and effective action as described at the Climate Plan.
Two videos complement this. Have a look at the video entitled Abrupt Climate Disrupting Arctic Changes: Part 2 of 2 by Paul Beckwith, in particular the segment from 8:30 to 12:00 minutes where Paul discusses how wind patterns are changing over the Arctic.
For further thoughts on the situation, also have a look at the video below in which Jennifer Hynes interviews Peter Wadhams.
Links
• Climate Plan
http://arctic-news.blogspot.com/p/climateplan.html
• Climate Plan summary
http://arctic-news.blogspot.com/p/summary.html
• Feedbacks
http://arctic-news.blogspot.com/p/feedbacks.html
• Extinction
http://arctic-news.blogspot.com/p/extinction.html
• Temperature
http://arctic-news.blogspot.com/p/temperature.html
• The University Centre in Svalbard: UNIS
http://www.unis.no/
• Danish Meteorological Institute (DMI)
http://ocean.dmi.dk/arctic/meant80n.uk.php
• Monthly CO₂ not under 400 ppm in 2016
http://arctic-news.blogspot.com/2016/11/monthly-co-not-under-400-ppm-in-2016.html
• Methane's Role in Arctic Warming
http://arctic-news.blogspot.com/2016/02/methanes-role-in-arctic-warming.html
• Gulf Stream brings ever warmer water into Arctic Ocean
http://arctic-news.blogspot.com/2015/06/gulf-stream-brings-ever-warmer-water-into-arctic-ocean.html
Lake Baikal
The amount of methane stored in the form of hydrates at the bottom of Lake Baikal in Siberia is an estimated 1 trillion m³, which translates into 424 trillion kg of methane, or 424 Gt of methane. By comparison, the amount of methane in the atmosphere is about 5 Gt.

Methane hydrates remain stable under a combination of sufficiently low temperatures and sufficiently high pressure. The temperature of the water at the bottom of the lake is about 3.5°C. This means that a large amount of water needs to remain present in the lake at any time, in order to keep the methane hydrates stable.
Lake Baikal is the world's deepest lake. Due to its depth, Lake Baikal is also the largest freshwater lake by volume in the world, containing roughly 20% of the world's unfrozen surface fresh water. Lake Baikal has 23,615.39 km³ (5,700 cu mi) of fresh water and a maximum depth of 1,642 m (5,387 ft).
If the water level in Lake Baikal were to fall, the pressure on the methane hydrates would decrease, resulting in huge methane eruptions, dwarfing the amount of methane currently in the atmosphere.
What are the chances that water levels in Lake Baikal will fall in future? The above animation shows the fate of the Aral Sea, further to the west in Asia (also on the map at top). The Aral Sea virtually disappeared over the course of the last few decades. Some people point at climate change as the cause. More people point at irrigation by farmers.
Lake Baikal could go the same way. Climate change may well reduce the flow of the rivers that now feed Lake Baikal from Mongolia (image right). Furthermore, climate change may well reduce crop yields worldwide as well as the availability of fresh water, increasing temptations to use the water of Lake Baikal for irrigation.
Further decline of Arctic sea ice is likely to push up temperatures across Russia. The image below shows that temperatures as high as 36.6°C or 97.8°F were forecast for June 13, 2016, over the Yenisei River in Siberia that ends in the Arctic Ocean.
Even higher temperatures were recorded in 2015 at a location in Siberia well within the Arctic Circle.
Demands for water could increase even more dramatically due to wildfires and the need to fight such fires. The image below shows that on June 23, 2016, wildfires north of Lake Baikal caused emissions as high as 22,953 ppb CO and 549 ppm CO₂ at the location marked by the green circle.
The situation is dire and calls for comprehensive and effective action, as described at the Climate Plan.
Links
• Climate Plan
http://arctic-news.blogspot.com/p/climateplan.html
• Gone: endemic Baikal sponge has died completely in several areas of the vast lake
http://siberiantimes.com/ecology/casestudy/features/f0278-gone-endemic-baikal-sponge-has-died-completely-in-several-areas-of-the-vast-lake/
• Volume to weight conversion
http://www.aqua-calc.com/calculate/volume-to-weight
• Lake Baikal, Wikipedia
https://en.wikipedia.org/wiki/Lake_Baikal
• Aral Sea, Wikipedia
https://en.wikipedia.org/wiki/Aral_Sea
• Climate Feedbacks Start To Kick In More
http://arctic-news.blogspot.com/2016/06/climate-feebacks-start-to-kick-in-more.html
• High Temperatures In Arctic
http://arctic-news.blogspot.com/2016/06/high-temperatures-in-arctic.html
• East Siberian Heat Wave
http://arctic-news.blogspot.com/2015/07/east-siberian-heat-wave.html
• Wildfires in Russia's Far East
http://arctic-news.blogspot.com/2016/08/wildfires-in-russias-far-east.html

 |
| Aral Sea |
Lake Baikal is the world's deepest lake. Due to its depth, Lake Baikal is also the largest freshwater lake by volume in the world, containing roughly 20% of the world's unfrozen surface fresh water. Lake Baikal has 23,615.39 km³ (5,700 cu mi) of fresh water and a maximum depth of 1,642 m (5,387 ft).
If the water level in Lake Baikal were to fall, the pressure on the methane hydrates would decrease, resulting in huge methane eruptions, dwarfing the amount of methane currently in the atmosphere.
What are the chances that water levels in Lake Baikal will fall in future? The above animation shows the fate of the Aral Sea, further to the west in Asia (also on the map at top). The Aral Sea virtually disappeared over the course of the last few decades. Some people point at climate change as the cause. More people point at irrigation by farmers.
 |
| Yenisei River |
Lake Baikal could go the same way. Climate change may well reduce the flow of the rivers that now feed Lake Baikal from Mongolia (image right). Furthermore, climate change may well reduce crop yields worldwide as well as the availability of fresh water, increasing temptations to use the water of Lake Baikal for irrigation.
Further decline of Arctic sea ice is likely to push up temperatures across Russia. The image below shows that temperatures as high as 36.6°C or 97.8°F were forecast for June 13, 2016, over the Yenisei River in Siberia that ends in the Arctic Ocean.
 |
| [ click on images to enlarge or go to original post ] |
Demands for water could increase even more dramatically due to wildfires and the need to fight such fires. The image below shows that on June 23, 2016, wildfires north of Lake Baikal caused emissions as high as 22,953 ppb CO and 549 ppm CO₂ at the location marked by the green circle.
 |
| [ click on images to enlarge or go to original post ] |
Links
• Climate Plan
http://arctic-news.blogspot.com/p/climateplan.html
• Gone: endemic Baikal sponge has died completely in several areas of the vast lake
http://siberiantimes.com/ecology/casestudy/features/f0278-gone-endemic-baikal-sponge-has-died-completely-in-several-areas-of-the-vast-lake/
• Volume to weight conversion
http://www.aqua-calc.com/calculate/volume-to-weight
• Lake Baikal, Wikipedia
https://en.wikipedia.org/wiki/Lake_Baikal
• Aral Sea, Wikipedia
https://en.wikipedia.org/wiki/Aral_Sea
• Climate Feedbacks Start To Kick In More
http://arctic-news.blogspot.com/2016/06/climate-feebacks-start-to-kick-in-more.html
• High Temperatures In Arctic
http://arctic-news.blogspot.com/2016/06/high-temperatures-in-arctic.html
• East Siberian Heat Wave
http://arctic-news.blogspot.com/2015/07/east-siberian-heat-wave.html
• Wildfires in Russia's Far East
http://arctic-news.blogspot.com/2016/08/wildfires-in-russias-far-east.html
Tombe thébaine n° 33 (TT 33) | Carnet de la mission épigraphique française dans la tombe de Padiaménopé (Pétaménophis) (7e s. av. J-Chr.)
Good website of one of the South Assasif Late period tombs
Tombe thébaine n° 33 (TT 33) | Carnet de la mission épigraphique française dans la tombe de Padiaménopé (Pétaménophis) (7e s. av. J-Chr.)
Tombe thébaine n° 33 (TT 33) | Carnet de la mission épigraphique française dans la tombe de Padiaménopé (Pétaménophis) (7e s. av. J-Chr.)
Over 20 of the most terrifying images of 2016
Remember the Paris Agreement? It was sealed on 12 December 2015, when nations triumphantly pledged to strengthen the global response to the threat of climate change, by "holding the increase in the global average temperature to well below 2°C above pre-industrial levels and pursuing efforts to limit the temperature increase to 1.5°C above pre-industrial levels, recognizing that this would significantly reduce the risks and impacts of climate change."

Months before the Paris Agreement was sealed, temperatures had already risen to more than 1.5°C above pre-industrial levels. Meanwhile, temperatures have been above the 1.5°C guardrail for most of the year 2016, i.e. for seven out of eleven months and this may well become eight out of twelve months once the full data for December 2016 is available. It was more than 1.5°C (2.7°F) warmer than pre-industrial for 10 out of the 14 months from October 2015 to November 2016.
The situation is dire. Little or no action is taken on climate change. Earth faces a potential temperature rise of more than 10°C or 18°F by 2026.
 The situation in the Arctic is critical. While Earth as a whole is experiencing rapid warming, warming in the Arctic is escalating even faster and this rise is accelerating, due to feedbacks such as snow and ice demise and destabilizing sediments at seafloor of the Arctic Ocean. These sediments contain huge amounts of methane in the form of hydrates and free gas.
Albedo changes associated with decline of Arctic sea ice and snow and ice cover on land in the Arctic could lead to a 1.6°C warming, while methane eruptions from the seafloor could well cause an additional 1.1°C temperature rise over the next decade.
This temperature rise will trigger further feedbacks such as a rise of water vapor in the atmosphere. Water vapor is a potent greenhouse gas that will further accelerate the temperature rise. In combination with further elements, the danger adds up to a potential global temperature rise of 10°C or 18°F by 2026.
The danger is described in more detail at the Extinction page. Below are further images illustrating the danger.
 Over the entire year 2016, warming was most profound over the Arctic Ocean, which was more than 2.5°C or 4.5°F warmer than 1981-2010, as illustrated by the image on the right.

The Arctic is hit particularly hard by warming. Warming of the air over the Arctic Ocean is taking place much faster than elsewhere on Earth, as illustrated by the animation underneath on the right.
This animation shows how this anomaly developed over the past few years, each time showing a 365-day period, starting in 2014 and each time shifted by roughly one month.
On November 19, 2016, the Arctic was 7.3°C or 13.14°F warmer than it was in 1979-2000, as the image below shows.
On that day, the Arctic Ocean in many places showed temperature anomalies at the top end of the scale, i.e. 20°C or 36°F warmer than it was in 1979-2000.
From the post Accelerating Warming of the Arctic Ocean.

The huge amounts of energy entering the oceans translate into higher temperatures of the water and of the air over the water, as well as higher waves and stronger winds. The North Atlantic Ocean is warming up rapidly and much ocean heat is carried by the Coriolis force along the Gulf Stream from the coast of North America through the North Atlantic into the Arctic Ocean.
The image below, from an earlier post, shows sea surface temperature anomalies on August 12, 2016, in the left-hand panel, and sea surface temperature anomalies in the right-hand panel.
Above image also shows that on August 12, 2016, sea surface temperatures near Svalbard (at the location marked by the green circle) were as high as 18.9°C or 65.9°F, an anomaly of 13.6°C or 24.4°F.

Above image shows on October 31, 2016, sea surface temperatures near Svalbard (at the location marked by the green circle) were as high as 187°C or 62.7°F, an anomaly of 13.9°C or 25°F.
 The image on the right shows that sea surface temperatures near Svalbard (green circle) were as high as 14.1°C or 57.3°F on December 6, 2016, 12.1°C or 21.7°F warmer than in 1981-2011.
This rise in ocean heat contributes strongly to the demise of Arctic snow and ice cover, and threatens to trigger ever larger eruptions of methane from the seafloor of the Arctic Ocean.
Thick sea ice covered with snow can reflect as much as 90% of the incoming solar radiation. After the snow begins to melt, and because shallow melt ponds have an albedo (or reflectivity) of approximately 0.2 to 0.4, the surface albedo drops to about 0.75. As melt ponds grow and deepen, the surface albedo can drop to 0.15, while the ocean reflects only 6% of the incoming solar radiation and absorbs the rest.

Over the past few years, trends have been pointing at zero thickness soon, i.e. in a matter of years. Rapid loss of sea ice thickness has taken place over the years, as discussed in a recent post. A trend based on PIOMAS volume data (preliminary for 2016) points at zero sea ice by end 2021, as illustrated by the graph below.

Collapse of the sea ice could well occur much earlier than the trend indicates. Thin sea ice is more vulnerable to the stronger storms that can be expected to hit the Arctic Ocean during the northern summer more frequently, and they could push huge amounts of ice out of the Arctic Ocean.
The sea ice also acts as a heat buffer, by absorbing energy in the process of melting. In other words, as long as there is sea ice, it will absorb heat and this will prevent this heat from raising the temperature of the water in the Arctic. Once the sea ice is gone, this latent heat must go elsewhere.
 As the sea ice heats up, 2.06 J/g of heat goes into every degree Celsius that the temperature of the ice rises. While the ice is melting, all energy (at 334J/g) goes into changing ice into water and the temperature remains at 0°C (273.15K, 32°F).
Once all ice has turned into water, all subsequent heat goes into heating up the water, at 4.18 J/g for every degree Celsius that the temperature of water rises.
The amount of energy absorbed by melting ice is as much as it takes to heat an equivalent mass of water from zero to 80°C.
Arctic sea ice volume has now decreased so much that this buffer is now largely gone and that a lot more heat will be absorbed by the Arctic. Sea ice acted as a buffer that used to consume massive amounts of ocean heat carried along sea currents into the Arctic Ocean. A huge amount of energy used to be absorbed by this buffer, i.e. by melting ice and transforming it into water. The energy that used to be absorbed by melting ice is as much as it takes to warm up an equivalent mass of water from zero°C to 80°C. Without sea ice to consume heat, the heat must go somewhere else. Much of this heat will then suddenly speed up warming of the water of the Arctic Ocean, rather than going into melting the ice as it did previously. So, the water of the Arctic Ocean will suddenly warm up dramatically. Remember that the Arctic Ocean in many areas is very shallow, in many places it's less than 50 m deep, as discussed in an earlier post.
Disappearance of the sea ice would mean that the buffer has gone, further increasing the danger of huge abrupt releases of methane from the seafloor of the Arctic Ocean. The danger is that this extra heat will reach the seafloor and destabilize methane hydrates that are contained in sediments at the bottom of the Arctic Ocean. This could result in huge methane eruptions. It is hard for methane plumes to get broken down in the water, given the abrupt and concentrated nature of such releases and given that the Arctic Ocean is in so many places very shallow. Once that methane enters the atmosphere, it will strongly contribute to further warming of the atmosphere over the Arctic.
As the water of the Arctic Ocean keeps warming, the danger increases that methane hydrates at the bottom of the Arctic Ocean will destabilize. As said, increases in temperature due to albedo changes and methane releases in the Arctic will go hand in hand with further feedbacks, including increased levels of water vapor in the atmosphere, warmer river water running into the Arctic Ocean and more soot from wildfires that will settle on the remaining sea ice.

Above image shows sea surface temperature anomalies in the Arctic (latitude 60°N-90°N) on October 9, 2016, compared to 1961-1990.

Above image shows sea surface temperature anomalies in the Arctic (latitude 60°N-90°N) on September 18, 2016, compared to 1961-1990.

Above image shows sea surface temperature anomalies in the Arctic (latitude 60°N-90°N) on September 4, 2016, compared to 1961-1990.

Above image shows sea surface temperature anomalies in the Arctic (latitude 60°N-90°N) on August 16, 2016, compared to 1961-1990.

Sea surface temperatures west of Svalbard were as high as 14.6°C (58.2°F) on December 29, 2016. Sea surface temperature went up at the end of December at this spot, while the longer-term average went down in line with the change in seasons. From the post: Accelerating Warming of the Arctic Ocean

Above image shows sea surface temperature as high as 14.6°C or 58.2°F on December 29, 2016, near Svalbard, as a result of warm water being pushed from the North Atlantic into the Arctic Ocean. From the post: Accelerating Warming of the Arctic Ocean.

Above image, from an earlier post, illustrates how a cold freshwater lid on the North Atlantic could result from stronger evaporation, in combination with meltwater, causing more heat to get carried into the Arctic Ocean underneath the sea surface, due to reduced heat transfer to the atmosphere from water on its way to the Arctic Ocean.

Note that there is a huge lack of monitoring of the situation regarding methane in the Arctic. Above image shows high methane levels recorded at Barrow, Alaska, that were later removed by NOAA.
While there may be uncertainty, due to limited availability of data, such uncertainty does not make the problem go away. The situation is critical; in many respects, we can just count ourselves lucky that much larger methane eruptions haven't occurred as yet.
The image below shows the recent situation, with trends pointing at an increase in the methane burden by a third by 2030 and a doubling by 2040.
Why again is methane so important? On a 10-year timescale, methane causes more warming than carbon dioxide. Unlike carbon dioxide, methane's Global Warming Potential rises as more of it is released. Methane's lifetime can be extended to decades, in particular due to depletion of hydroxyl in the atmosphere.
Ominously, methane levels were very high over the Laptev Sea (solid magenta color north of Siberia) on November 9, 2016. The image below also shows that on November 9, 2016, methane levels were as high as 2633 parts per billion.
As the water of the Arctic Ocean keeps warming, the danger increases that methane hydrates at the bottom of the Arctic Ocean will destabilize.

The danger is further illustrated by the two images above and below, recorded by the MetOp2 satellite on the afternoon of Christmas eve and Christmas.

Continued warming could trigger huge abrupt methane eruptions leading to mass destruction and extinction.
To top it off, the image below shows that growth in CO₂ levels appears to be accelerating.
According to NOAA, mean global carbon dioxide grew from 2004-2014 by an average 2.02 ppm per year. For 2015 the growth rate was 2.98 ppm. As an indication for what the 2016 growth rate will be, global CO₂ levels grew by 3.57 ppm between September 2015 and September 2016, and by 3.71 ppm between October 2015 and October 2016.
The final two images show a potential temperature rise from preindustrial to 2026 of 9.7°C (annual average) and 10.02°C (monthly peak), and below a prognosis of the number of climate-related global deaths in line with the action taken.
The situation is dire and calls for comprehensive and effective action as described at the Climate Plan.
Links
A pdf of the extinction page and a summary of the Climate Plan can be downloaded from
https://sites.google.com/site/samcarana/climateplan/Climate-Plan-by-Sam-Carana.pdf?attredirects=0&d=1
• Climate Plan
https://arctic-news.blogspot.com/p/climateplan.html
• Climate Plan - Summary
http://arctic-news.blogspot.com/p/summary.html
• Methane
https://arctic-news.blogspot.com/p/methane.html
• Extinction
https://arctic-news.blogspot.com/p/extinction.html
• FAQs (Frequently asked questions)
http://arctic-news.blogspot.com/p/faq.html
• Seafloor Methane

Months before the Paris Agreement was sealed, temperatures had already risen to more than 1.5°C above pre-industrial levels. Meanwhile, temperatures have been above the 1.5°C guardrail for most of the year 2016, i.e. for seven out of eleven months and this may well become eight out of twelve months once the full data for December 2016 is available. It was more than 1.5°C (2.7°F) warmer than pre-industrial for 10 out of the 14 months from October 2015 to November 2016.
The situation is dire. Little or no action is taken on climate change. Earth faces a potential temperature rise of more than 10°C or 18°F by 2026.
 |
| [ click on images to enlarge or go to original post ] |
Albedo changes associated with decline of Arctic sea ice and snow and ice cover on land in the Arctic could lead to a 1.6°C warming, while methane eruptions from the seafloor could well cause an additional 1.1°C temperature rise over the next decade.
This temperature rise will trigger further feedbacks such as a rise of water vapor in the atmosphere. Water vapor is a potent greenhouse gas that will further accelerate the temperature rise. In combination with further elements, the danger adds up to a potential global temperature rise of 10°C or 18°F by 2026.
The danger is described in more detail at the Extinction page. Below are further images illustrating the danger.
|
| Potential temperature rise of more than 10°C or 18°F by 2026 (from: Climate Plan Summary, see also: the extinction page) |
The Arctic is hit particularly hard by warming. Warming of the air over the Arctic Ocean is taking place much faster than elsewhere on Earth, as illustrated by the animation underneath on the right.
This animation shows how this anomaly developed over the past few years, each time showing a 365-day period, starting in 2014 and each time shifted by roughly one month.
On November 19, 2016, the Arctic was 7.3°C or 13.14°F warmer than it was in 1979-2000, as the image below shows.
On that day, the Arctic Ocean in many places showed temperature anomalies at the top end of the scale, i.e. 20°C or 36°F warmer than it was in 1979-2000.
From the post Accelerating Warming of the Arctic Ocean.

These high temperatures over the Arctic Ocean reflect warm water of the Arctic Ocean, with heat added from the Atlantic Ocean and the Pacific Ocean. The image below shows the warming of the oceans. Temperatures are rising particularly rapidly on the Northern Hemisphere.
|
| [ Ocean warming, from earlier post ] |
The image below, from an earlier post, shows sea surface temperature anomalies on August 12, 2016, in the left-hand panel, and sea surface temperature anomalies in the right-hand panel.
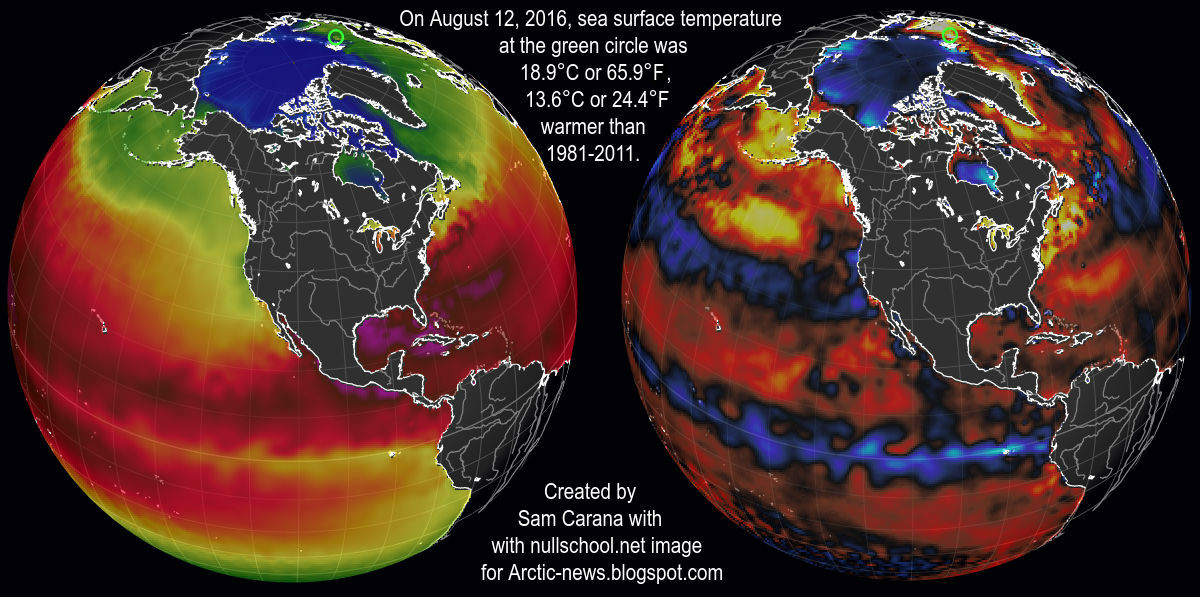 |
| Sea surface temperature and anomaly. Anomalies from +1°C to +2°C are red, above that they turn yellow and white |

Above image shows on October 31, 2016, sea surface temperatures near Svalbard (at the location marked by the green circle) were as high as 187°C or 62.7°F, an anomaly of 13.9°C or 25°F.

This rise in ocean heat contributes strongly to the demise of Arctic snow and ice cover, and threatens to trigger ever larger eruptions of methane from the seafloor of the Arctic Ocean.
Thick sea ice covered with snow can reflect as much as 90% of the incoming solar radiation. After the snow begins to melt, and because shallow melt ponds have an albedo (or reflectivity) of approximately 0.2 to 0.4, the surface albedo drops to about 0.75. As melt ponds grow and deepen, the surface albedo can drop to 0.15, while the ocean reflects only 6% of the incoming solar radiation and absorbs the rest.
Over the past few years, trends have been pointing at zero thickness soon, i.e. in a matter of years. Rapid loss of sea ice thickness has taken place over the years, as discussed in a recent post. A trend based on PIOMAS volume data (preliminary for 2016) points at zero sea ice by end 2021, as illustrated by the graph below.

Collapse of the sea ice could well occur much earlier than the trend indicates. Thin sea ice is more vulnerable to the stronger storms that can be expected to hit the Arctic Ocean during the northern summer more frequently, and they could push huge amounts of ice out of the Arctic Ocean.
The sea ice also acts as a heat buffer, by absorbing energy in the process of melting. In other words, as long as there is sea ice, it will absorb heat and this will prevent this heat from raising the temperature of the water in the Arctic. Once the sea ice is gone, this latent heat must go elsewhere.
Once all ice has turned into water, all subsequent heat goes into heating up the water, at 4.18 J/g for every degree Celsius that the temperature of water rises.
The amount of energy absorbed by melting ice is as much as it takes to heat an equivalent mass of water from zero to 80°C.
Arctic sea ice volume has now decreased so much that this buffer is now largely gone and that a lot more heat will be absorbed by the Arctic. Sea ice acted as a buffer that used to consume massive amounts of ocean heat carried along sea currents into the Arctic Ocean. A huge amount of energy used to be absorbed by this buffer, i.e. by melting ice and transforming it into water. The energy that used to be absorbed by melting ice is as much as it takes to warm up an equivalent mass of water from zero°C to 80°C. Without sea ice to consume heat, the heat must go somewhere else. Much of this heat will then suddenly speed up warming of the water of the Arctic Ocean, rather than going into melting the ice as it did previously. So, the water of the Arctic Ocean will suddenly warm up dramatically. Remember that the Arctic Ocean in many areas is very shallow, in many places it's less than 50 m deep, as discussed in an earlier post.
 |
| [ The Buffer has gone, feedback #14 on the Feedbacks page ] |
As the water of the Arctic Ocean keeps warming, the danger increases that methane hydrates at the bottom of the Arctic Ocean will destabilize. As said, increases in temperature due to albedo changes and methane releases in the Arctic will go hand in hand with further feedbacks, including increased levels of water vapor in the atmosphere, warmer river water running into the Arctic Ocean and more soot from wildfires that will settle on the remaining sea ice.

Above image shows sea surface temperature anomalies in the Arctic (latitude 60°N-90°N) on October 9, 2016, compared to 1961-1990.

Above image shows sea surface temperature anomalies in the Arctic (latitude 60°N-90°N) on September 18, 2016, compared to 1961-1990.

Above image shows sea surface temperature anomalies in the Arctic (latitude 60°N-90°N) on September 4, 2016, compared to 1961-1990.

Above image shows sea surface temperature anomalies in the Arctic (latitude 60°N-90°N) on August 16, 2016, compared to 1961-1990.
Sea surface temperatures west of Svalbard were as high as 14.6°C (58.2°F) on December 29, 2016. Sea surface temperature went up at the end of December at this spot, while the longer-term average went down in line with the change in seasons. From the post: Accelerating Warming of the Arctic Ocean
Above image shows sea surface temperature as high as 14.6°C or 58.2°F on December 29, 2016, near Svalbard, as a result of warm water being pushed from the North Atlantic into the Arctic Ocean. From the post: Accelerating Warming of the Arctic Ocean.
Above image, from an earlier post, illustrates how a cold freshwater lid on the North Atlantic could result from stronger evaporation, in combination with meltwater, causing more heat to get carried into the Arctic Ocean underneath the sea surface, due to reduced heat transfer to the atmosphere from water on its way to the Arctic Ocean.

 |
| (view more images at the methane page) |
While there may be uncertainty, due to limited availability of data, such uncertainty does not make the problem go away. The situation is critical; in many respects, we can just count ourselves lucky that much larger methane eruptions haven't occurred as yet.
The image on the right shows historic growth rates of methane (CH4), carbon dioxide (CO₂) and nitrous oxide (N2O). Methane levels increased most (256% of 1750 levels in 2015, red), much more than carbon dioxide (144% of 1750 levels in 2015, blue) or nitrous oxide (121% of 1750 levels in 2015, green).
The image below shows the recent situation, with trends pointing at an increase in the methane burden by a third by 2030 and a doubling by 2040.
 |
| [ click on images to enlarge or go to original post ] |
 |
| [ click on images to enlarge or go to original post ] |
 |
| [ click on images to enlarge or go to original post ] |
The danger is further illustrated by the two images above and below, recorded by the MetOp2 satellite on the afternoon of Christmas eve and Christmas.
Continued warming could trigger huge abrupt methane eruptions leading to mass destruction and extinction.
To top it off, the image below shows that growth in CO₂ levels appears to be accelerating.
 |
| [ click on images to enlarge or go to original post ] |
|
| [ Potential temperature rise from preindustrial to 2026. For details see original post and the Temperature page. |
 |
| [ click on images to enlarge or go to original post ] |
The situation is dire and calls for comprehensive and effective action as described at the Climate Plan.
Links
A pdf of the extinction page and a summary of the Climate Plan can be downloaded from
https://sites.google.com/site/samcarana/climateplan/Climate-Plan-by-Sam-Carana.pdf?attredirects=0&d=1
• Climate Plan
https://arctic-news.blogspot.com/p/climateplan.html
• Climate Plan - Summary
http://arctic-news.blogspot.com/p/summary.html
• Methane
https://arctic-news.blogspot.com/p/methane.html
• Extinction
https://arctic-news.blogspot.com/p/extinction.html
• FAQs (Frequently asked questions)
http://arctic-news.blogspot.com/p/faq.html
• Seafloor Methane
http://arctic-news.blogspot.com/2016/12/seafloor-methane.html
• Monthly CO₂ not under 400 ppm in 2016
http://arctic-news.blogspot.com/2016/11/monthly-co-not-under-400-ppm-in-2016.html
• How Much Warming Have Humans Caused?
http://arctic-news.blogspot.com/2016/05/how-much-warming-have-humans-caused.html
• Sea ice is shrinking
http://arctic-news.blogspot.com/2016/11/sea-ice-is-shrinking.html
• Less, sea ice, warmer water
http://arctic-news.blogspot.com/2016/11/less-sea-ice-warmer-arctic-ocean.html
• Accelerating Warming of the Arctic Ocean
http://arctic-news.blogspot.com/2016/12/accelerating-warming-of-the-arctic-ocean.html
Subscribe to:
Posts (Atom)